
Last updated: June 2026
«How much monthly income will $X generate» is one of the most common questions dividend investors ask — and one of the easiest to answer with the wrong number, because most online calculators either ignore taxes, ignore the trade-offs of high-yield funds, or quietly assume a yield holds steady forever. This guide walks through real numbers using actual current yields from well-known dividend ETFs, so you can see exactly what different investment sizes translate to in monthly terms — and what you give up to get a higher number.
(Note: Before mapping out your capital, it is critical to determine if a bundled fund is the right vehicle for your income goals in the first place. You can read our comprehensive head-to-head analysis on Are Dividend ETFs Better Than Individual Dividend Stocks? to weigh the trade-offs of control versus instant diversification).
Disclaimer: This article is for informational and educational purposes only and does not constitute financial advice. Dividend yields fluctuate and are never guaranteed — the figures below are illustrative based on data available as of June 2026, not a promise of future income. Always do your own research and consider speaking with a licensed financial advisor or tax professional before building an income plan.
The two types of dividend ETFs, and why the distinction matters here
Before running any numbers, it’s worth separating dividend ETFs into two categories, because they answer «how much monthly income» very differently:
- Traditional dividend ETFs (like SCHD, VYM, DGRO) hold dividend-paying stocks directly and typically pay quarterly, with yields generally in the 2-4% range.
- Covered call / option-income ETFs (like JEPI, JEPQ) generate additional income by selling call options against their holdings, typically pay monthly, and post much higher headline yields — often 8% or more — but cap how much upside they capture during strong bull markets.
Both can produce «monthly income» in practice (traditional funds’ quarterly payouts can be averaged into a monthly figure; option-income funds pay monthly directly), but the underlying total return picture is meaningfully different, which matters more than the headline yield number alone.
What different investment sizes generate: traditional dividend ETFs
Using SCHD’s current yield of approximately 3.3% as a representative example:
| Investment | Approx. Annual Income | Approx. Monthly Equivalent |
|---|---|---|
| $10,000 | ~$330 | ~$27.50 |
| $50,000 | ~$1,650 | ~$137.50 |
| $100,000 | ~$3,300 | ~$275 |
| $250,000 | ~$8,250 | ~$687.50 |
| $500,000 | ~$16,500 | ~$1,375 |
Note: SCHD pays quarterly, not monthly — the «monthly equivalent» column simply divides the annual total by 12 for comparison purposes. Actual payments arrive four times a year, not as steady monthly deposits.
For comparison, VYM’s lower yield (roughly 2.1-2.8%) and DGRO’s lower yield still (roughly 1.8-2.1%) would produce correspondingly smaller income figures at the same investment size — a reminder that «dividend ETF» doesn’t mean a single, predictable income number across the category.
What different investment sizes generate: high-yield covered call ETFs
Using JEPI’s current yield of approximately 8.3% (paid monthly) as a representative example:
| Investment | Approx. Annual Income | Approx. Monthly Income |
|---|---|---|
| $10,000 | ~$830 | ~$69 |
| $50,000 | ~$4,150 | ~$346 |
| $100,000 | ~$8,300 | ~$692 |
| $250,000 | ~$20,750 | ~$1,729 |
| $500,000 | ~$41,500 | ~$3,458 |
At first glance, this looks like a dramatically better deal than SCHD — roughly 2.5x the income at the same investment size. But this is exactly where the «how much income» question becomes incomplete without the rest of the picture.
The trade-off that headline yield numbers hide
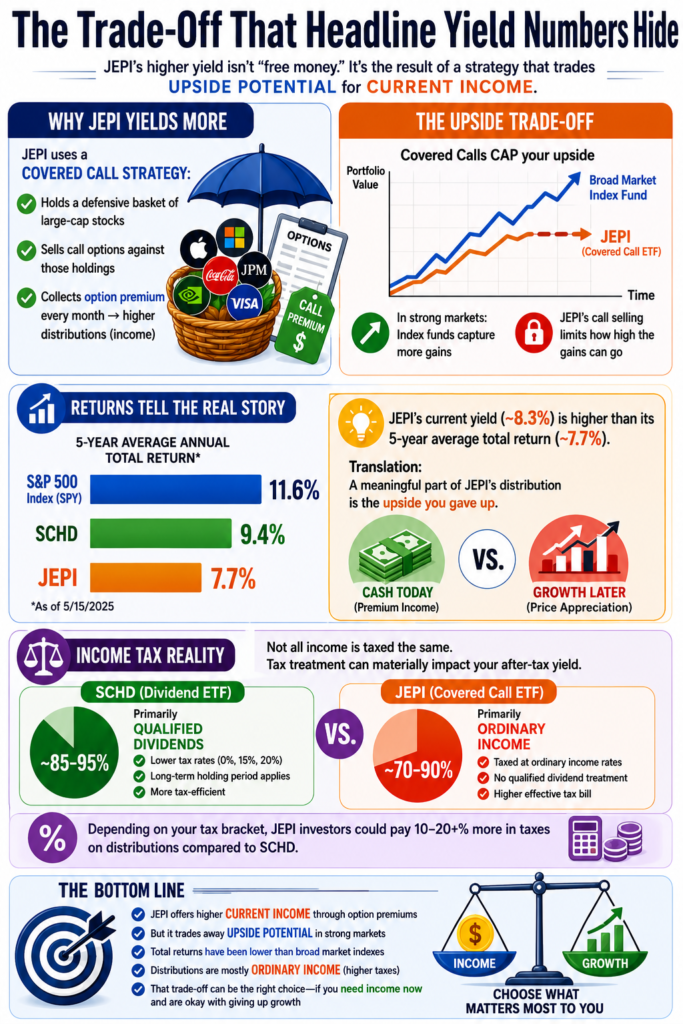
JEPI’s higher yield comes from its covered call strategy: the fund holds a defensive basket of large-cap stocks and systematically sells call options against them, generating extra premium income but capping how much of the market’s upside the fund can capture when stocks rally hard. According to fund data, JEPI’s 5-year average annual return sits at roughly 7.7% — notably lower than its current 8.3% yield figure, and well below what a broad market index fund has delivered over comparable recent periods.
This isn’t a flaw exactly — it’s the explicit design. Covered call ETFs trade upside participation for current income, which can be a reasonable choice for someone who specifically needs cash flow now and is willing to give up some long-term growth potential to get it. But it means JEPI’s higher «monthly income» number is not simply free money compared to SCHD’s lower number — part of what you’re receiving as a distribution is, in effect, capital you would have otherwise captured as price appreciation in a strong market.
It’s also worth noting that covered call ETF distributions are often taxed primarily as ordinary income rather than qualified dividends, which can mean a higher effective tax rate on JEPI’s distributions compared to SCHD’s, depending on your account type and tax bracket — another factor that headline yield figures don’t capture.
How much would you need invested to generate specific monthly income targets?
Using SCHD’s approximate 3.3% yield:
| Target Monthly Income | Approx. Required Investment |
|---|---|
| $500/month ($6,000/yr) | ~$182,000 |
| $1,000/month ($12,000/yr) | ~$364,000 |
| $2,000/month ($24,000/yr) | ~$727,000 |
| $4,000/month ($48,000/yr) | ~$1,455,000 |
Using JEPI’s approximate 8.3% yield:
| Target Monthly Income | Approx. Required Investment |
|---|---|
| $500/month ($6,000/yr) | ~$72,000 |
| $1,000/month ($12,000/yr) | ~$145,000 |
| $2,000/month ($24,000/yr) | ~$289,000 |
| $4,000/month ($48,000/yr) | ~$578,000 |
These figures illustrate why high-yield funds attract so much attention from income-focused investors — the required principal to hit a given monthly target is dramatically lower on paper. But as covered above, that lower required principal comes with the trade-off of capped upside participation and less favorable tax treatment on much of the distribution.
Why yields aren’t fixed, and what that means for your plan
None of the yields used in these tables are guaranteed or fixed. A few things to keep in mind:
- Traditional dividend ETF yields move with both price and underlying companies’ payout decisions. If the fund’s share price rises faster than dividends grow, the yield percentage falls (and vice versa). Underlying companies can also cut or suspend dividends during financial difficulty.
- Covered call ETF distributions are explicitly variable. JEPI’s monthly distribution amount fluctuates based on options premium income, which itself depends on market volatility — generally higher in volatile markets, lower in calm ones. There’s no fixed «8.3%» promise; that’s simply the trailing yield as of a specific date.
- Past yield is not a guarantee of future yield. Any of the figures used in the tables above can be meaningfully different a year from now, in either direction.
So how should you actually think about this?
Rather than chasing the single highest headline yield, a more complete framework considers:
- Total return, not just yield. A fund with a lower yield but stronger price appreciation can still outperform a higher-yield fund on a total return basis over time — which matters even if your goal is current income, since it affects how much principal you have working for you long-term.
- Tax treatment, particularly for covered call funds, where a larger share of distributions may be taxed as ordinary income — sometimes making these funds better suited to tax-advantaged accounts like an IRA or 401(k) than a taxable brokerage account.
- Your actual need for current income versus long-term growth. Investors who need cash flow now (e.g., in retirement) have different priorities than investors decades from needing the money, for whom a lower-yield, higher-total-return fund may build more long-term wealth even with smaller current distributions.
Frequently asked questions
Can I actually live off dividend ETF income? That depends entirely on your invested principal relative to your living expenses. As the tables above show, generating even $2,000/month in dividend income requires a substantial six- or seven-figure investment, depending on which fund’s yield you’re using. This is a long-term wealth-building goal for most investors, not something achieved quickly without a large existing portfolio.
Is a higher yield always better for generating monthly income? Not necessarily, for the reasons covered above — a higher yield (especially from covered call funds) can come with capped upside, less favorable tax treatment, and more income variability than a lower, steadier yield from a traditional dividend fund.
Should I put high-yield funds like JEPI in a retirement account instead of a taxable account? Many financial commentators suggest this, given that a larger share of covered call ETF distributions is often taxed as ordinary income rather than qualified dividends. Whether this applies to your specific situation depends on your tax bracket and account types, and is worth confirming with a tax professional.
How accurate are the income figures in this article? The figures are illustrative estimates based on yields available as of June 2026, intended to show the general scale of income different investment sizes can generate — not precise guarantees. Actual income will vary based on the fund’s real-time yield, your specific share price at purchase, and any changes to the underlying dividend or distribution policy.