
Last updated: June 2026
The case for international diversification has never been more concrete than it is right now. In the first half of 2026, international ETFs collectively pulled in an estimated $68 billion in net inflows — a figure that reflects a genuine shift in how investors are thinking about the U.S.-heavy portfolios they’ve built over the past decade. International equities are trading at roughly 17x earnings versus the U.S. market’s roughly 22x forward P/E — a valuation gap that has started translating into real performance advantages this year, with broad international funds outpacing the S&P 500 year-to-date at several points.
This guide covers the full landscape: broad international funds that give you everything in one ticker, developed-market-only funds that reduce volatility, emerging-market funds that add growth potential, and the key factors investors routinely overlook when comparing international ETFs — from currency risk to index construction to China exposure.
Disclaimer: This article is for informational and educational purposes only and does not constitute financial advice. International investing involves additional risks, including currency fluctuations, political instability, and regulatory differences across countries. Past performance does not guarantee future results. Always do your own research and consider speaking with a licensed financial advisor before investing.
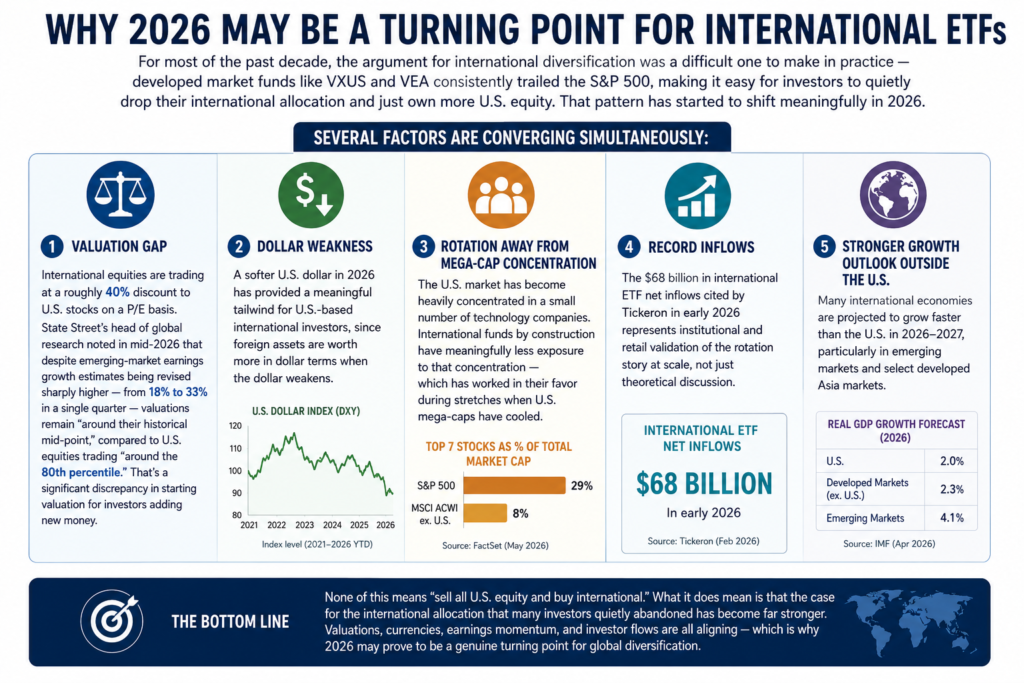
Why 2026 may be a turning point for international ETFs
For most of the past decade, the argument for international diversification was a difficult one to make in practice — developed market funds like VXUS and VEA consistently trailed the S&P 500, making it easy for investors to quietly drop their international allocation and just own more U.S. equity. That pattern has started to shift meaningfully in 2026.
Several factors are converging simultaneously:
- Valuation gap: International equities are trading at a roughly 40% discount to U.S. stocks on a P/E basis. State Street’s head of global research noted in mid-2026 that despite emerging-market earnings growth estimates being revised sharply higher — from 18% to 33% in a single quarter — valuations remain «around their historical mid-point,» compared to U.S. equities trading «around the 80th percentile.» That’s a significant discrepancy in starting valuation for investors adding new money.
- Dollar weakness: A softer U.S. dollar in 2026 has provided a meaningful tailwind for U.S.-based international investors, since foreign assets are worth more in dollar terms when the dollar weakens.
- Rotation away from mega-cap concentration: As covered elsewhere on this site, the U.S. market has become heavily concentrated in a small number of technology companies. International funds by construction have meaningfully less exposure to that concentration — which has worked in their favor during stretches when U.S. mega-caps have cooled.
- Record inflows: The $68 billion in international ETF net inflows cited by Tickeron in early 2026 represents institutional and retail validation of the rotation story at scale, not just theoretical discussion.
None of this means «sell all U.S. equity and buy international.» What it does mean is that the case for the international allocation that many investors quietly abandoned over the past decade is more compelling in 2026 than it’s been in years.
How international ETFs are categorized
Before comparing specific funds, it’s worth establishing the taxonomy, because «international ETF» can mean very different things:
| Category | What it includes | Representative ETFs |
|---|---|---|
| Total international (ex-U.S.) | All countries outside the U.S. — developed + emerging | VXUS, IXUS |
| Developed markets only | Wealthy, stable economies — Europe, Japan, Australia, Canada | VEA, IEFA |
| Emerging markets only | Faster-growing but higher-risk economies — China, India, Brazil, Taiwan | VWO, EEM, IEMG |
| Currency-hedged | International stocks with the foreign currency effect removed | HEFA, DBEF |
| Single-region or country | Focus on a specific region (Europe) or country (Japan, India) | EWJ, INDA, VGK |
Each category answers a different investment question. A total international fund is the «one and done» approach. A developed-markets-only fund reduces volatility at the cost of missing emerging-market growth. An emerging-market fund adds growth potential with meaningfully higher risk. Currency-hedged funds remove the FX variable entirely — relevant for some investors, not for others.
Section 1: Total International ETFs
These are the broadest funds available — a single ticker that gives you exposure to essentially the entire world outside the U.S.
Vanguard Total International Stock ETF (VXUS)
VXUS is the most commonly cited «core international holding» for long-term, globally diversified portfolios. It tracks the FTSE Global All Cap ex-US Index, holding over 8,700 stocks across both developed and emerging markets, covering approximately 99% of investable international market capitalization.
Key facts (source: Vanguard, Dividend Vision, as of June 2026):
- Expense ratio: 0.05%
- AUM: approximately $149 billion
- Holdings: ~8,700+ stocks
- Trailing 12-month total return: approximately 32.56%
- 10-year annualized return: approximately 9.99% (per Dividend Vision comparison data)
- Dividend yield: approximately 1.78%, paid quarterly
- Geographic split: approximately 75–80% developed markets, 20–25% emerging markets (reflecting global market cap weights)
- Top country exposures: Japan, UK, Canada, France, Germany, Switzerland, Australia, Taiwan, India, China
VXUS’s inclusion of emerging markets adds growth potential but introduces the volatility and regulatory risks associated with countries like China, Brazil, and India. For investors who want a single fund that covers «everything outside the U.S.,» VXUS is the standard answer.
iShares Core MSCI Total International Stock ETF (IXUS)
IXUS is iShares’ equivalent to VXUS — broad global ex-U.S. coverage, open-end fund structure, low cost. The key differences are index provider (IXUS tracks MSCI, VXUS tracks FTSE) and cost (IXUS charges 0.07% versus VXUS’s 0.05%).
Key facts (source: Dividend Vision, as of June 2026):
- Expense ratio: 0.07%
- Trailing 12-month total return: approximately 31.69%
- Dividend yield: approximately 2.54%, paid semi-annually (notably higher than VXUS)
- Holdings: broadly similar universe to VXUS, with minor differences due to MSCI vs. FTSE index methodology
The higher yield from IXUS may appeal to income-focused investors, though the semi-annual payment schedule is less frequent than VXUS’s quarterly. IXUS and VXUS are not perfectly interchangeable because they track different indexes from different providers, which means they can serve as tax-loss harvesting partners (you can sell one and immediately buy the other without triggering a wash-sale rule issue, since they track different benchmarks).
Total international ETFs: side-by-side
| VXUS | IXUS | |
|---|---|---|
| Issuer | Vanguard | iShares / BlackRock |
| Index | FTSE Global All Cap ex-US | MSCI ACWI ex-USA IMI |
| Expense ratio | 0.05% | 0.07% |
| AUM | ~$149B | Smaller |
| Dividend yield | ~1.78% (quarterly) | ~2.54% (semi-annual) |
| TTM total return | ~32.56% | ~31.69% |
| Includes emerging markets? | Yes | Yes |
| Tax-loss harvesting partner? | Yes (with IXUS) | Yes (with VXUS) |
Section 2: Developed Markets ETFs
Developed-market international funds exclude emerging economies, giving investors exposure to wealthy, more politically stable countries — Europe, Japan, Australia, Canada, and similar — without the added volatility of China, Brazil, or India.
Vanguard FTSE Developed Markets ETF (VEA)
VEA is currently the largest developed-markets ETF in the world at roughly $223 billion in assets, and according to recent data it has also been the strongest performer of the major international funds over the trailing 12 months.
Key facts (source: Vanguard, Dividend Vision, Tickeron, as of June 2026):
- Expense ratio: 0.03% — one of the lowest of any international ETF, period
- AUM: approximately $223 billion
- Holdings: approximately 3,900 stocks (large, mid, and small-cap in developed markets outside the U.S.)
- Trailing 12-month total return: approximately 33.85% — the highest of the major international funds in this comparison
- 10-year annualized return: approximately 10.66%
- Dividend yield: approximately 2.09%, paid quarterly
- Portfolio turnover: approximately 2.9%, reflecting minimal rebalancing activity
- Top country exposures: Japan (~21%), UK (~13%), Canada (~10%), France (~9%), Germany (~8%), Switzerland (~8%)
- Top sectors: Financials (~23%), Industrials (~16%), Technology (~15%), Consumer Discretionary (~11%), Basic Materials (~7%)
VEA’s ultra-low 0.03% expense ratio — on par with VOO and VTI — is exceptional for an international fund and one of its clearest competitive advantages. Its full-replication methodology and low turnover mean minimal drag from trading costs or cash management.
iShares Core MSCI EAFE ETF (IEFA)
IEFA is the iShares equivalent to VEA — developed markets, ex-U.S., broadly diversified. It tracks the MSCI EAFE Index (Europe, Australasia, and Far East), which excludes Canada (MSCI’s definition of «EAFE» doesn’t include North America), making IEFA’s geographic scope slightly narrower than VEA’s.
Key facts (source: Dividend Vision, The Motley Fool, as of June 2026):
- Expense ratio: 0.07%
- AUM: large, highly liquid (one of the most-traded international ETFs)
- Trailing 12-month total return: approximately 22.56%
- Dividend yield: approximately 3.24%, paid semi-annually — the highest yield of any fund in this comparison
- Key difference from VEA: excludes Canada; tracks MSCI rather than FTSE
IEFA’s notably higher distribution yield may appeal to income-focused investors, though its semi-annual payment schedule and slightly higher cost relative to VEA are trade-offs worth weighing. IEFA and VEA track different indexes from different providers, making them valid tax-loss harvesting partners.
Developed markets ETFs: side-by-side
| VEA | IEFA | |
|---|---|---|
| Issuer | Vanguard | iShares / BlackRock |
| Index | FTSE Developed All Cap ex-US | MSCI EAFE |
| Expense ratio | 0.03% | 0.07% |
| AUM | ~$223B | Large and liquid |
| Includes Canada? | Yes | No |
| Dividend yield | ~2.09% (quarterly) | ~3.24% (semi-annual) |
| TTM total return | ~33.85% | ~22.56% |
| 10-year annualized | ~10.66% | — |
| Tax-loss harvesting partner? | Yes (with IEFA) | Yes (with VEA) |
Section 3: Emerging Markets ETFs
Emerging market ETFs add exposure to faster-growing economies — China, India, Taiwan, Brazil, South Korea, and others — at the cost of higher volatility, political risk, and currency risk. In 2026, this category has attracted renewed attention: EEM was up approximately 23% year-to-date through mid-2026, compared to the S&P 500’s roughly 9% over the same period, according to U.S. News data.
Vanguard FTSE Emerging Markets ETF (VWO)
VWO is the largest emerging markets ETF by assets and the clear cost leader in the category.
Key facts (source: PortfoliosLab, Nasdaq, Vanguard, as of June 2026):
- Expense ratio: 0.06–0.08% (sources vary slightly; consistently among the lowest in the category)
- AUM: approximately $146 billion
- Holdings: over 2,000–6,000 stocks depending on source/measurement date, spanning large- and mid-cap emerging market companies
- Dividend yield: approximately 2.46–2.8% (trailing twelve months, per PortfoliosLab/Nasdaq)
- 10-year annualized return: approximately 9.07%
- Key feature: tracks FTSE Emerging Markets All Cap China A Inclusion Index, which includes mainland Chinese A-shares — an important distinction from MSCI-based funds
- Top holdings: Taiwan Semiconductor Manufacturing, Tencent, Alibaba among the largest positions
VWO’s A-share inclusion gives it a different China exposure profile than MSCI-based competitors, which is a meaningful structural difference. China A-shares (mainland Chinese stocks) behave differently from the H-shares (Hong Kong-listed Chinese stocks) that dominate MSCI-based funds, giving VWO investors a different risk/return profile within China specifically.
iShares MSCI Emerging Markets ETF (EEM)
EEM is the oldest and one of the most heavily traded emerging markets ETFs — but it’s also the most expensive by a wide margin.
Key facts (source: PortfoliosLab, Motley Fool, U.S. News, as of June 2026):
- Expense ratio: approximately 0.72%
- AUM: approximately $25 billion (substantially smaller than VWO)
- Holdings: approximately 1,200 stocks
- Trailing 12-month dividend yield: approximately 1.84%
- 10-year annualized return: approximately 9.74% — modestly above VWO’s 9.07%
- Key difference from VWO: tracks MSCI Emerging Markets Index, excludes China A-shares, includes South Korea
EEM’s 0.72% expense ratio is dramatically higher than VWO — roughly 9-10 times more expensive — which, as The Motley Fool calculated in June 2026, translates to approximately $65 more per year on a $10,000 investment. That gap is compounding against EEM investors every year. EEM’s marginally higher 10-year return hasn’t offset the expense disadvantage for most buy-and-hold investors over any reasonable holding period.
EEM still has a use case: its South Korea inclusion and deep options market liquidity make it relevant for traders and for investors with a specific view on South Korean technology companies (like Samsung) that don’t appear in VWO or FTSE-based emerging market funds.
iShares Core MSCI Emerging Markets ETF (IEMG)
IEMG is essentially a lower-cost upgrade to EEM from the same issuer — same MSCI methodology, broader holdings, much lower price.
Key facts (source: U.S. News, as of June 2026):
- Expense ratio: 0.09%
- Holdings: over 2,600 stocks — more than double EEM’s roughly 1,200
- Key advantage over EEM: same MSCI-based methodology at a fraction of the cost
- Tax-loss harvesting: IEMG and VWO track different indexes (MSCI vs. FTSE), making them valid tax-loss harvesting partners
For investors who want MSCI-based emerging market exposure — for example, specifically to include South Korea, which FTSE classifies as developed rather than emerging — IEMG is the more rational choice over EEM in almost every scenario.
Emerging markets ETFs: side-by-side
| VWO | EEM | IEMG | |
|---|---|---|---|
| Issuer | Vanguard | iShares | iShares |
| Index | FTSE Emerging Markets All Cap China A | MSCI Emerging Markets | MSCI Emerging Markets IMI |
| Expense ratio | ~0.06–0.08% | ~0.72% | 0.09% |
| AUM | ~$146B | ~$25B | Large |
| Holdings | 2,000–6,000+ | ~1,200 | 2,600+ |
| China A-shares? | Yes | No | No |
| South Korea included? | No (FTSE classifies as developed) | Yes | Yes |
| TTM dividend yield | ~2.46% | ~1.84% | — |
| 10-year annualized | ~9.07% | ~9.74% | — |
| Best for | Cost-conscious buy-and-hold investors | Active traders, South Korea exposure | MSCI methodology at reasonable cost |
Section 4: Currency risk — the factor most international ETF comparisons skip
One of the most important variables in international investing that headline performance figures don’t capture is currency risk. When you own an international ETF as a U.S.-based investor, your returns depend on two things simultaneously: the performance of the foreign stocks themselves, and the movement of the foreign currencies those stocks are priced in relative to the U.S. dollar.
When the dollar weakens (as it has at various points in 2026), the value of foreign holdings increases in dollar terms — providing a performance tailwind for international ETFs beyond the underlying stock returns. When the dollar strengthens, the reverse happens: even strong foreign stock market performance can be partially or fully offset by currency losses.
This is why «currency-hedged» versions of international funds exist. ETFs like HEFA (iShares Currency Hedged MSCI EAFE) and DBEF (Xtrackers MSCI EAFE Hedged Equity) hold the same underlying international stocks as their unhedged equivalents, but add currency derivatives that remove the FX effect — meaning their returns reflect only the underlying stock performance, not the dollar’s movement.
Should you use hedged or unhedged international ETFs?
| Unhedged (e.g., VEA, VXUS) | Currency-hedged (e.g., HEFA, DBEF) | |
|---|---|---|
| Returns include | Stock performance + FX movement | Stock performance only |
| Better when | Dollar is weakening | Dollar is strengthening |
| Expense ratio | Generally lower | Slightly higher (hedging costs money) |
| Best for | Long-term investors, neutral dollar view | Investors with a specific «strong dollar» view |
| Complexity | Low | Higher — requires monitoring the hedging cost |
For long-term investors with no specific conviction about the dollar’s direction, unhedged funds (VEA, VXUS, IEFA) are typically the simpler and lower-cost default. Currency hedging adds a layer of complexity and cost that tends to benefit investors more in specific rate environments than as a permanent portfolio feature.
Section 5: Choosing the right international ETF for your portfolio
By investment goal
| Goal | Recommended approach |
|---|---|
| Single-fund total international exposure | VXUS (broadest, low cost, includes emerging) |
| Developed markets only, lowest cost | VEA (0.03%, largest developed-market fund) |
| Developed markets, higher income | IEFA (3.24% yield, semi-annual, MSCI methodology) |
| Emerging markets, lowest cost | VWO (0.06–0.08%) |
| Emerging markets with South Korea, reasonable cost | IEMG (0.09%, MSCI-based) |
| Tax-loss harvesting pairs | VXUS ↔ IXUS; VEA ↔ IEFA; VWO ↔ IEMG |
By risk tolerance
| Risk preference | Approach |
|---|---|
| Lower risk, stable economies | VEA or IEFA (developed markets only) |
| Moderate risk, full international exposure | VXUS (developed + emerging, market-cap weighted) |
| Higher risk, emerging-market growth focus | VWO or IEMG (pure emerging markets) |
| Actively manages FX risk | Hedged variant like HEFA or DBEF |
How much international allocation is reasonable?
This is a genuinely debated question, and honest sources disagree. The global market-cap weight approach — holding international stocks in proportion to their share of global equity market capitalization — would suggest a roughly 40% international allocation for a globally diversified equity portfolio, since non-U.S. stocks represent approximately 40% of total global equity market value. In practice, most U.S. investors hold considerably less, often in the 15–30% range, sometimes called a «home country bias» tilt.
There’s no definitively correct answer — the «right» international allocation depends on your personal risk tolerance, existing portfolio, and long-term investment horizon, none of which this article can determine for you. What’s worth stating plainly is that holding zero international exposure is an active bet on continued U.S. outperformance, and that starting valuation gap between U.S. and international equities as of mid-2026 is the largest in many years.
Key risks of international investing that every investor should understand
No international ETF guide would be complete without a clear-eyed look at the risks that global diversification introduces:
Currency risk: As covered above, your returns depend partly on exchange rate movements that have nothing to do with the underlying companies’ performance.
Political and regulatory risk: International markets — particularly in emerging economies — carry risks that don’t exist in U.S. markets. Regulatory changes in China (affecting Chinese tech companies), political instability in emerging economies, capital controls, or nationalization of industries are real risks that have affected fund returns in the past.
Liquidity differences: International markets, particularly in emerging countries, can have lower trading volumes and wider bid-ask spreads than U.S. markets, which can affect the precision with which an ETF tracks its underlying index.
Tax treatment differences: Dividends from international ETFs may be subject to foreign withholding taxes before they reach U.S. investors, and the tax treatment of international distributions can differ from domestic dividends. This is worth confirming with a tax professional, particularly for large international allocations in taxable accounts.
Time zone and settlement differences: A minor operational consideration, but international ETF prices can diverge from their underlying NAV during U.S. trading hours when foreign markets are closed — a factor more relevant for active traders than buy-and-hold investors.
Frequently asked questions
Is 2026 finally the year to invest internationally? Valuation metrics and YTD 2026 performance have both favored international over U.S. equities at several points this year, but no one can reliably predict whether this represents a short-term rotation or the beginning of a sustained multi-year trend. What’s measurable is that the valuation gap between international and U.S. equities is at its widest in years — a historically favorable starting point for international allocation, even if timing any specific year’s outperformance is impossible.
What’s the difference between VEA and VXUS? The primary difference is that VXUS includes emerging markets (adding China, India, Brazil, Taiwan, etc.) while VEA covers only developed markets (Europe, Japan, Australia, Canada). VEA also charges a slightly lower 0.03% expense ratio versus VXUS’s 0.05%, and is the larger fund by assets ($223B vs. $149B). For investors who want to control their emerging-market exposure separately, VEA paired with VWO or IEMG gives more flexibility than VXUS alone.
Why does MSCI classify South Korea as emerging while FTSE classifies it as developed? This is a genuine index methodology difference with real portfolio implications. MSCI still classifies South Korea as an emerging market, while FTSE upgraded it to developed status. This means VWO (FTSE-based) excludes South Korea, while EEM and IEMG (MSCI-based) include it. If Samsung, SK Hynix, and other South Korean companies are important to your thesis, MSCI-based funds like IEMG are the more straightforward way to get that exposure.
Should I use a total international fund like VXUS, or separate developed and emerging funds? VXUS is the simpler, lower-maintenance approach — one fund covers everything at market-cap weights. Separating into VEA + VWO (or IEFA + IEMG) gives you the ability to adjust your developed vs. emerging market weighting beyond the default market-cap allocation, which is useful if you have a specific view on one category over the other. The two-fund approach also makes tax-loss harvesting easier. The trade-off is managing two positions instead of one.
Do international ETFs pay dividends? Yes — all of the funds covered here pay dividends, with yields generally ranging from about 1.8% to 3.2% as of mid-2026. International companies have historically tended to pay higher dividend yields than U.S. companies as a category, which makes international ETFs particularly relevant for income-oriented investors alongside their diversification role.