
Last updated: June 2026 | Reading time: 9 min
Disclaimer: This article is for informational and educational purposes only. Nothing here constitutes financial advice. Past performance is not a guarantee of future results. Always consult a licensed financial advisor before making investment decisions.
The Hidden Cost Nobody Talks About
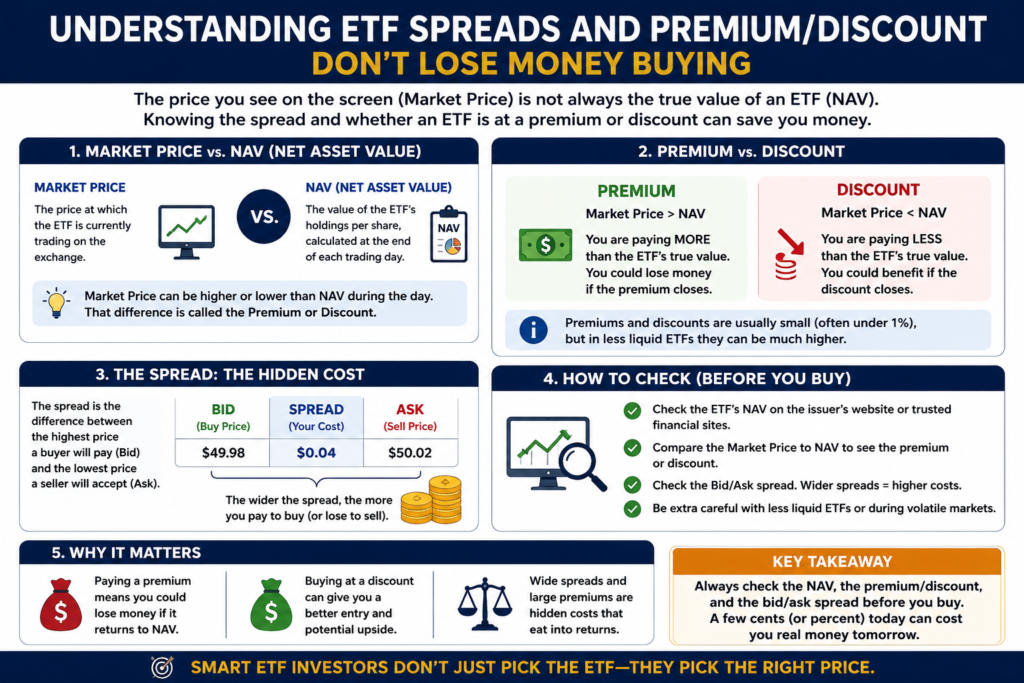
Most investors who are new to ETFs learn quickly about expense ratios — the annual fee that gets deducted from the fund’s assets. What far fewer investors understand is that every time you buy or sell an ETF, there are two additional costs that can quietly erode your returns: the bid-ask spread, and the premium or discount to net asset value at which the ETF is trading.
(Beyond trading friction, keeping an eye on fiscal drag is just as vital if you are not investing through a tax-sheltered account; you can check out our guide on the best tax-efficient ETFs for your taxable brokerage account to minimize what you lose to Uncle Sam).
For a fund like SPY or VYM, none of this matters much — the costs are fractions of a cent per share. But move into smaller, thinner sector funds, niche thematic ETFs, or bond ETFs built on illiquid underlying assets, and these same costs can quietly run 0.5%, 1%, or more on every single transaction. Put $50,000 into a fund like that, pay 1% going in and 1% coming out, and you’ve handed over $1,000 that will never appear as a «fee» anywhere — it just vanishes from your return.
This isn’t advanced portfolio theory. It’s basic hygiene for anyone who buys ETFs.
What a Bid-Ask Spread Actually Is
At any given moment, every exchange-traded security has two live prices, not one: the bid (the highest price a buyer is currently willing to pay) and the ask (the lowest price a seller is currently willing to accept). The gap between them is the spread — and it’s effectively the toll you pay for the privilege of trading immediately, collected by the market makers and liquidity providers on the other side of your order.
Place a market order to buy, and you pay the ask. Sell, and you receive the bid — always the lower of the two. You pay this cost on both ends of every trade, whether you notice it or not.
Here’s what that looks like in practice: SPY, trading around $530 a share, typically has a spread of roughly a penny — about 0.002% of the share price. Effectively invisible. Now take a thinly traded thematic ETF trading around $40 a share with only a few thousand shares changing hands per day. Its spread might run $0.30 — around 0.75% of the price. Trade that fund regularly over several years, and that «invisible» cost adds up to something very visible on your returns.
Checking the Spread Takes Thirty Seconds — Do It
Before buying any ETF that isn’t one of the giant, obvious index funds, pull up the current bid and ask on your brokerage platform or on ETF.com. The math is simple: subtract the bid from the ask, divide by the midpoint of the two, and multiply by 100 to get a percentage.
Use this rough scale to judge what you’re looking at:
- Under 0.05% — excellent, essentially a non-issue
- 0.05%–0.15% — acceptable for most investors
- 0.25%+ — worth pausing on. Ask yourself whether the fund offers something genuinely unique that justifies the extra cost
- 0.5%+ — a real drag on returns, especially if you trade often or hold for a shorter period
One thing to keep in mind: this number isn’t fixed. Spreads breathe throughout the trading day — tightening when liquidity is deep, widening when it isn’t. Which leads to one of the more practical, underrated rules in ETF investing.
Never Trade at the Open or the Close
The first thirty minutes after the market opens at 9:30 AM Eastern are reliably the worst time to trade an ETF. Market makers are still digesting overnight news, moves in international markets, and pre-market activity — liquidity is thin, spreads are wide, and even modest orders can push prices around more than they should.
The last fifteen to thirty minutes before the 4:00 PM close carry similar risk, particularly around quarter-end, when institutional rebalancing floods the market with unusual order flow.
If you’re a long-term investor buying and holding for years, the difference between a 9:35 AM fill and an 11:00 AM fill won’t move the needle on your outcome. But building the habit of trading mid-session — roughly 10:00 AM to 3:30 PM Eastern — means you’re consistently transacting when spreads are tightest and liquidity is deepest. It costs nothing to build that habit and it quietly protects you every single time you trade.
What Net Asset Value Means and Why It Matters
Every ETF holds a portfolio of underlying securities — stocks, bonds, commodities, or some combination. The net asset value, or NAV, is the per-share value of those underlying holdings calculated at the end of each trading day. It is the true intrinsic value of one share of the ETF based on what the fund actually owns.
Because ETFs trade on exchanges like stocks, their market price fluctuates throughout the day based on supply and demand — and that market price does not always match the NAV exactly. When the ETF’s market price is above its NAV, the ETF is trading at a premium. When the market price is below NAV, it is trading at a discount.
For large equity ETFs tracking liquid markets — S&P 500 funds, total market funds, large-cap international funds — a sophisticated arbitrage mechanism keeps premiums and discounts extremely tight, usually within a few basis points. Authorized participants can create or redeem large blocks of ETF shares in exchange for the underlying securities, and this mechanism continuously pushes the ETF price back toward NAV whenever it drifts.
The problems arise in markets where that arbitrage mechanism cannot operate freely.
Where Premiums and Discounts Actually Get Dangerous
Bond ETFs — especially those holding high-yield corporate debt, municipal bonds, or emerging-market bonds — can trade at meaningful premiums or discounts because the underlying bonds themselves don’t trade continuously. During real market stress (a credit event, a sudden rate spike, a geopolitical shock), the ETF can keep trading on the exchange while the bond market underneath it effectively seizes up. In those moments, the gap between price and NAV can widen sharply and fast.
International ETFs run into a related issue. A U.S.-listed ETF holding Japanese stocks keeps trading during U.S. hours, long after the Tokyo Stock Exchange has closed for the day. Its price adjusts to new information — currency swings, overnight futures, macro headlines — that the «stale» NAV from the Tokyo close hasn’t caught up to yet, which can push the ETF noticeably above or below that last official NAV.
Thematic and niche ETFs with small AUM and thin trading are the highest-risk group of all. If sentiment turns and a lot of holders try to sell a small fund at once, discounts can widen sharply — costing exiting investors real money relative to what the fund actually holds underneath.
How to Check Whether You’re Paying a Premium
The most reliable source for real-time premium and discount information is the ETF issuer’s own website. iShares, Vanguard, Schwab, Invesco, and all major issuers publish intraday indicative values — sometimes called IIV or iNAV — which update every fifteen seconds during market hours and give you a real-time estimate of the underlying portfolio’s value.
Comparing the current market price to the iNAV tells you immediately whether you are buying at a premium or a discount. ETF.com also maintains historical premium and discount data for most funds, which shows you the typical range an ETF trades within and flags funds that regularly diverge from NAV by unusual amounts.
As a general rule, any ETF that consistently trades more than 0.25% away from its NAV deserves scrutiny. The reason for that persistent divergence tells you something important about the liquidity of the underlying assets and the efficiency of the arbitrage mechanism.
The Simplest Fix: Use Limit Orders
If there’s one habit worth adopting from this entire topic, it’s this: use limit orders, not market orders, when trading ETFs.
A market order tells your broker «fill this now, whatever it costs.» In a liquid fund during calm markets, that’s harmless. In a thinner fund, or during a volatile moment, it can fill at a price meaningfully worse than the last quote you saw — a gap known as slippage.
A limit order instead tells your broker «only fill this at my price or better.» If an ETF is quoted at a $50.00 ask, you might set your limit at $50.02 — enough buffer to fill under normal conditions, while protecting you from an execution at $50.20 during a moment of thin liquidity.
For long-term investors making occasional purchases in liquid funds, the practical difference is usually small. But the habit costs nothing to build, and it pays off exactly in the moments that matter most — which tend to be the same moments markets are stressed and you’re most likely to be trading on emotion anyway.
Which ETFs Are Actually Low-Risk on Liquidity
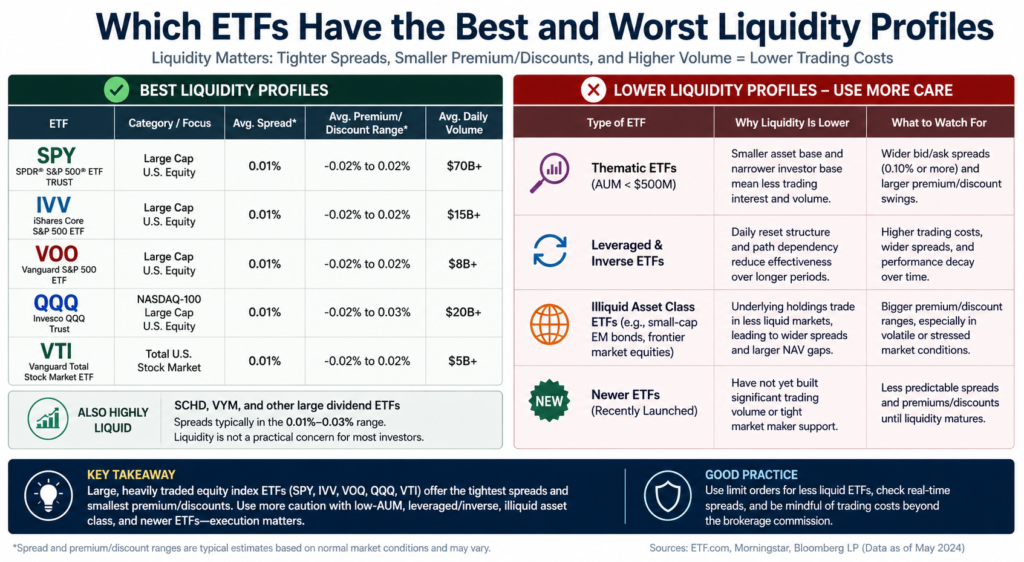
The safest funds on this front are the giants: SPY, IVV, VOO, QQQ, and VTI all trade billions of dollars daily and almost never stray meaningfully from NAV. You can buy or sell any of these at nearly any point during normal market hours without worrying about anything beyond your brokerage’s standard commission.
SCHD, VYM, and other large dividend ETFs sit in a similarly comfortable place, typically running spreads of just 0.01%–0.03%. For most dividend investors, liquidity simply isn’t a practical concern here.
Where you need to pay more attention: thematic ETFs under roughly $500 million in AUM, leveraged and inverse ETFs (which reset daily and can drift from their expected values over time), funds built on genuinely illiquid assets like frontier-market equities or small-cap emerging-market bonds, and newer ETFs that haven’t yet built up meaningful trading volume. None of these are automatically bad investments — but they demand more care at the point of execution than simply firing off a market order and walking away.
The Practical Checklist
Before buying any ETF, spend sixty seconds on three things: the current spread as a percentage of share price, whether the fund is trading at a notable premium or discount to NAV, and its average daily volume as a proxy for real-world liquidity. All three are free and available on ETF.com, your brokerage, or the issuer’s site.
From there: use limit orders instead of market orders, trade mid-session instead of at the open or close, and be extra careful with bond ETFs and small thematic funds specifically during periods of market stress — that’s exactly when spreads blow out and discounts widen the fastest.
For most investors sticking to large, liquid index funds, none of this will matter often in practice. Its real value is as a filter: it tells you the moment a fund you’re considering has stepped outside that safe zone, and gives you a framework for deciding whether the trade-off is actually worth it.
Frequently Asked Questions
Does the bid-ask spread show up as a fee on my brokerage statement? No — and that’s exactly why so many investors never notice it. The spread is baked directly into your execution price, not itemized anywhere. The only way to actually see it is to compare your fill price to the bid-ask midpoint at the moment you traded.
Is it better to buy an ETF at a discount to NAV? In theory, yes — you’re paying less than the underlying assets are worth. In practice, for large liquid ETFs that discount is usually too small to matter. For less liquid funds, a persistent discount can sometimes signal a structural problem rather than a bargain, so it’s worth understanding why the discount exists before treating it as free money.
Can spreads and premiums alone cause me to lose money on an ETF? On their own, unlikely to cause outright losses on a long-term hold — but they can meaningfully dent returns, especially for frequent traders or anyone in less liquid funds. The risk climbs sharply during market dislocations, when spreads widen and bond ETF discounts can become significant.
How do I find an ETF’s iNAV during market hours? Most issuers publish it directly on the fund’s detail page, refreshed roughly every fifteen seconds; ETF.com shows it too. The iNAV ticker is usually the fund’s ticker with a prefix (for example, iVOO for VOO), though the exact convention varies by exchange and issuer.
Do limit orders always fill? No. If the price moves away from your limit before it executes, the order simply won’t go through. For large purchases in less liquid ETFs, this is a real consideration — you may need to adjust your limit or split the purchase into smaller tranches across multiple sessions rather than trying to fill it all at once.